FIT: measuring how well NBA players fit together
This started with a question as a Spurs fan. Next to another center who can't shoot, Victor Wembanyama gets pushed out to the wing on offense, away from finishing plays at the rim. You can see it when you watch. I wanted to know if it could be measured.
Where it stands: the data pipeline, the baseline model and the dashboards are built. The fit model isn't built yet, so FIT can't predict a lineup today.
The problem
The best public impact stats are built on RAPM, a ridge regression over every stretch of a game where the same 10 players are on the floor. It gives each player one number and assumes he adds that same amount in every lineup. Fit gets averaged away.
The usual alternative is to look at how a pair of players did when they shared the floor. But those samples are small, and they say nothing about players who have never played together. That is exactly the question a team has before a trade.
FIT's plan is to describe each player by a small set of skills, such as spacing, rim pressure and rim protection, then learn from every lineup how those skills combine. Because it learns from skills and not from specific pairs, it could estimate a lineup before that lineup has ever played.
Bad data first
A model can't tell you when its data is wrong, and nobody would catch a bad player rating by looking at it. So before any modeling, every game has to pass three checks. A game that fails is saved to a file and left out. I don't try to patch it.
| Check | What it catches | Games failed |
|---|---|---|
| Points add up to the official final score | Missing or misread plays | 20 |
| Every stint has exactly 5 players per team | Lineups that were rebuilt wrong | 13 |
| Stints cover the whole game | Gaps in the timeline | 0 |
| Games left out (a game can fail more than one check) | 32 | |
| Clean games used | 592 | |
In the clean games, team points match the official score in all 1,184 of 1,184 team-games. No game has failed the timeline check so far. I'm keeping it anyway, because a zero I can see is better than a problem I can't.
What real data did to the plan
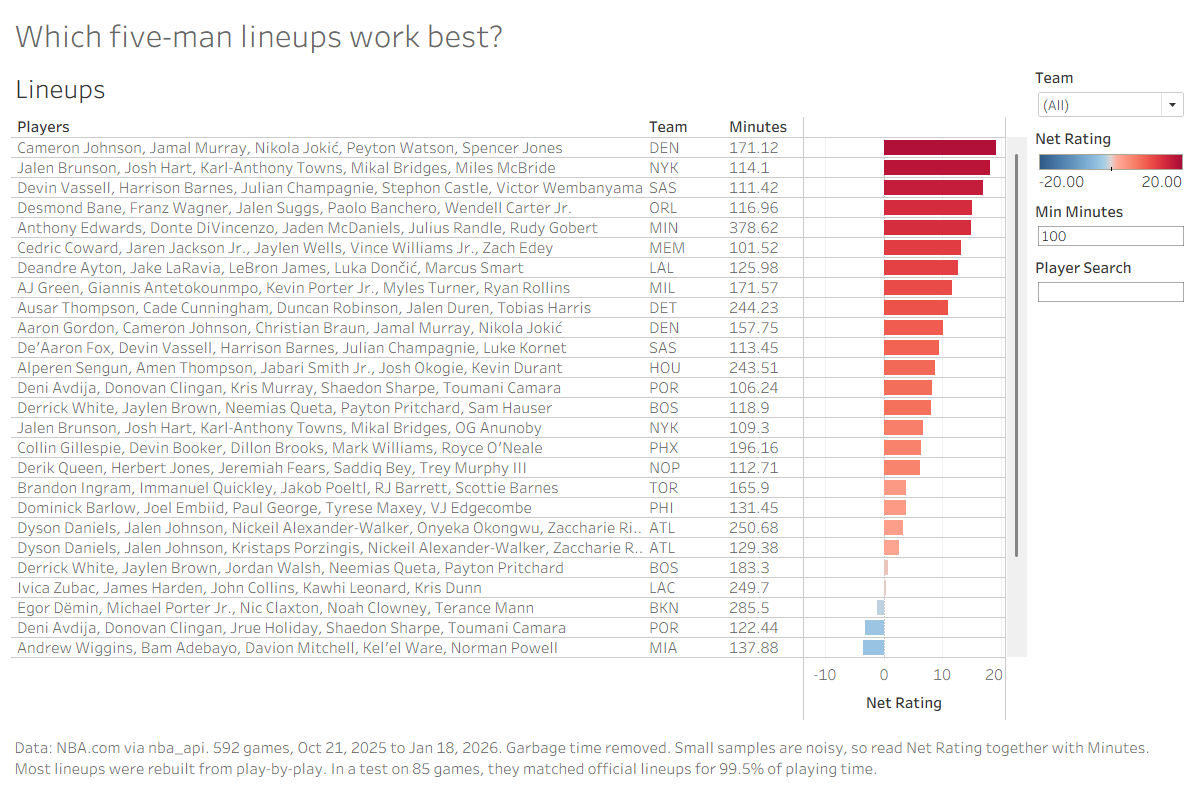
- NBA.com doesn't always return lineups. Its rotation data returns an error for some games, so I rebuild those lineups from the play-by-play. In a test on 85 games, the rebuilt lineups matched the official ones for 99.5% of playing time.
- Requests time out. Pulling a full season takes over an hour, so failed requests retry with a growing wait, and each game saves to its own file. If the run stops, I rerun it and it picks up where it left off.
- I started small. The notebook first ran on 20 games. Only once that worked did I scale it up.
The number FIT has to beat
The baseline is plain RAPM: a ridge regression weighted by possessions. The penalty is picked by cross-validation, and the splits are by game, so stints from the same game can't appear in both training and testing.
The rule for FIT is simple. Train on past seasons and predict the next one, against plain RAPM and public metrics on the same games. If a new layer doesn't improve predictions on games the model hasn't seen, it doesn't go in.
Dashboards
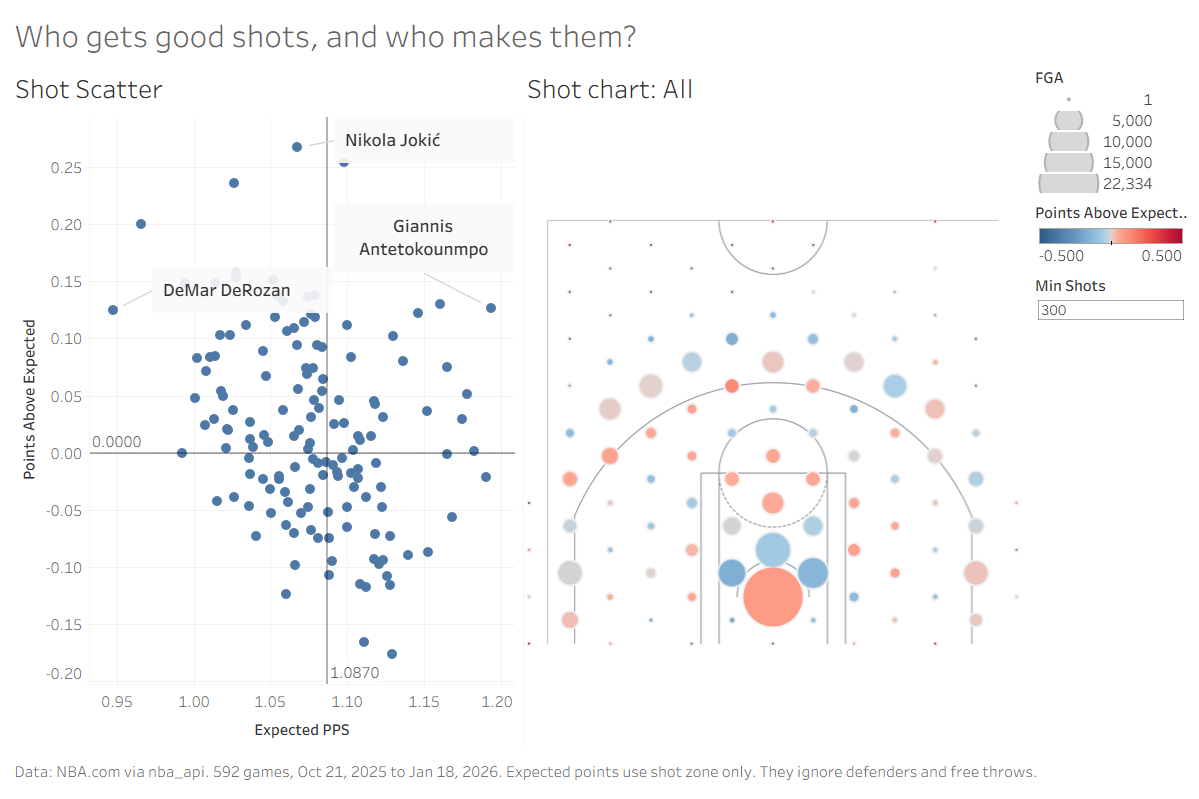
You don't need to run a notebook to see the data. I built two Tableau dashboards from the clean data. They are a side product of the pipeline, not part of the FIT model.
What's next
Pull the rest of the season, then replace made and missed shots with what each shot is usually worth, to take shooting luck out of the scoreboard. After that come the skill profiles and the fit model itself.
Data comes from NBA.com through the nba_api Python package. RAPM builds on years of public work in basketball analytics.